Choose timezone
Your profile timezone:
Annual workshop on the physical processes of volcanic eruptions, their measurement and interpretation. This meeting is supported by the DFG, AG Vulkanologie.

The aim of the 6th workshop taking place at the University of Hamburg is to get together volcanologists exploring the physics and processes at active volcanoes around the world. New developments in technologies and methods as well as new insights and scientific results shall be presented and discussed to strengthen our research network. To maximise interaction, there will be both talks and presentations of posters. Colleagues from research centers, universities, labs, and others, are very welcome to contribute.
The topical sessions cover:
+ Subsurface & Surface processes
+ Atmospheric processes
+ Monitoring and risk assessment
There will be no overlapping sessions, ensuring that participants remain together to share new ideas and subjects.
Registration and Abstract submission will be open from December 1st to January 12th.
Participation is limited to 120 persons.
| Deutsche Vulkanologische Gesellschaft | Deutsche Geophysikalische Gesellschaft | ||
| METEK GmbH | MIN Fakultät, Universität Hamburg | ||
| Schweizerbart'sche Verlagsbuchhandlung |  |
Springer Verlag |
The distributed volcanic fields of the West German Eifel region had their last eruptions less than 13,000 years ago. Recently, so-called deep low frequency (DLF) earthquakes were discovered under one of the Quaternary volcanic fields, which gives clear evidence of ongoing magmatic activity in the lower crust. Complementary gas geochemical, petrological and volcanological investigations support models of active magmatic processes at greater depths. Although different geophysical profiles were measured above the active volcanic fields of the Eifel in the early 1980s, these have rarely been interpreted in terms of magmatism and crustal reservoir processes. In this work, seismic wide-angle and steep-angle experiments are compiled, partly reworked and interpreted together with other geophysical data to discuss the type, size and shape of possible magmatic reservoirs in the deeper crust beneath the Eifel volcanic fields.
We review and discuss wide angle seismic data and the evidence of a low velocity zone below the Moho, which extends over a larger region of volcanic fields of the Rhenish Massif. We show that the DLF earthquakes connect the low velocity layer in the upper mantle with the upper crust at a depth of about 8 km directly below one of the youngest phonolitic volcanic centres in the Easteifel, where CO$_2$ from the mantle is massively outgassing.
Below the Tertiary and Quaternary fields of the Western Eifel, a prominent transparent zone in the lower crust was identified in 1987 in steep angle reflection seismic data. Above this zone a "bright spot" reflection band correlates with a strong magnetic anomaly and was interpreted as a solidified magmatic reservoir. We use reprocessed reflection seismic data to discuss the seismic signature of this reservoir in the middle crust and compare it with ongoing magmatic processes in the Eastern Eifel.
The reprocessed data indicate that the Moho is staggered below the Siegen Thrust System (ST). The ST correlates with the transparent lower crustal wedge in the West Eifel and possibly similar in the Westerwald at a distance of about 120 km and coincides with the velocity anomaly of the upper mantle identified in wide angle refraction data. We speculate whether the distribution of Quaternary and Tertiary volcanic fields in the Rhenish massif is controlled by tectonic features in the crust.
Seismic tomography is the state-of-the-art technique for imaging the Earth. When applied to magmatic systems, phase-dependent imaging (e.g. travel-time tomography or noise interferometry) has shown the potential to broadly resolve magmatic anomalies. Here, I show recent advances in tomographic imaging of collisional continental structures at the upper mantle scale in SE Asia, with their influence on the distribution of magmatic systems. Then, I focus on the latest results of seismic attenuation (amplitude) tomography applied to crustal magmatic systems using both coherent waves and the stochastic signature of heterogeneities on seismic wavefields. The development of sensitivity kernels modeled using a multiple scattering description of seismic wavefields provides improved models of heterogeneous structures and better connections with alternative volcanological observations. The examples provided will span the Cascadian Arc (Mount St. Helens), Campi Flegrei caldera (Southern Italy) and Deception Island (Antarctica). Advanced imaging techniques, as full-waveform inversions and amplitude interferometry, remain biased in magmatic systems, without an improved understanding of the physics underlying anisotropy, multiple-scattering propagation and shallow-heterogeneity interaction, even if coverage substantially improves.
Oldoinyo Lengai volcano, located in the Natron Basin (Tanzania), is the only active natrocarbonatite volcano world-wide. As such, it presents an important endmember magmatic system, which occurs in a young rift segment (~3 Ma) of the East African Rift System. At this volcano, effusive episodes of long-duration are interrupted by short-duration explosive eruptions. At the end of February 2019, we installed a dense seismic network and four infrasound stations as part of the SEISVOL - Seismic and Infrasound Networks to Study the Volcano Oldoinyo Lengai - project. The seismic network spans an area of 30 x 30 km and encompasses Oldoinyo Lengai volcano, the extinct 1 Ma-old Gelai shield volcano, the active Naibor Soito monogenetic cone field and surrounding fault population. Here, we present temporal earthquake distributions combined with 2D absorption and scattering imaging.
On average, we report up to 34 earthquakes per day within and in the vicinity of our network. Given the dense station spacing, we are able to lower the detection threshold to -1.0 ML with a MC of -0.3. During the first months of data acquisition, the seismicity is clustered in distinct areas as background seismicity and in intermittent seismic swarms:
1. Most of the events are located beneath the eastern and southern flank of Gelai shield volcano. These events are shallow and close to the dike intrusion that preceded the last explosive eruption of Oldoinyo Lengai in 2007-2008.
2. In April 2019, a seismic swarm of ~262 earthquakes in three days forms a pipe-like structure beneath the north western flank of Gelai.
3. Deeper events cluster beneath the monogenetic cone field located just NE of Oldoinyo Lengai. A distinct gap in seismicity can be traced down to 10 km depth between the monogenetic cone field and Gelai volcano.
4. While there seems to be little seismicity directly beneath Oldoinyo Lengai in the upper 5 km of the crust, we observe a number of different, recurring seismic and infrasound signals at the crater, which are indicative of magmatic activity.
To image the magmatic plumbing system, we map scattering and absorption of the seismic dataset using the MuRAT (Multi-Resolution Attenuation Tomography) code. Our preliminary results show two well-resolved high-absorption and high-scattering anomalies below Oldoinyo Lengai and the Gelai intrusion in 2007 at all frequencies. With decreasing frequency (increasing depth) the anomalies converge, suggesting a link of the plumbing systems at depth.
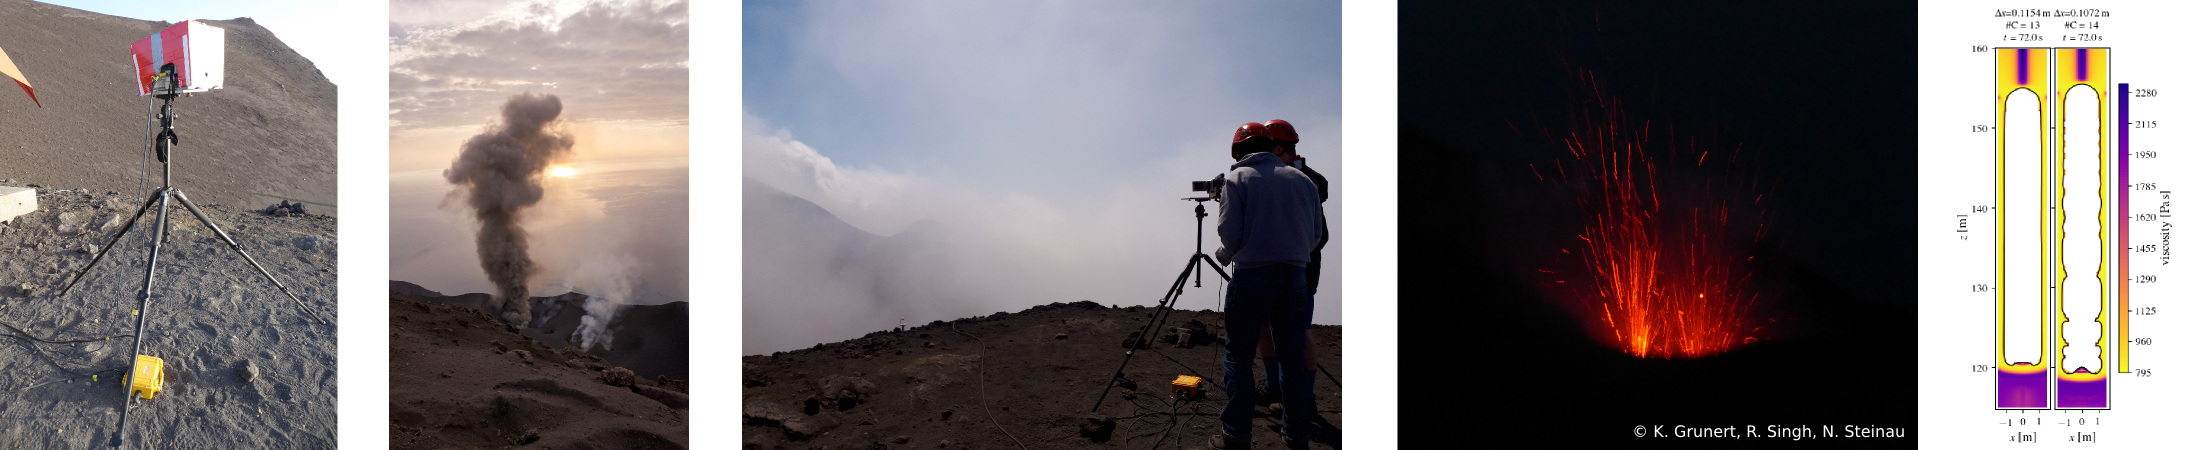
Volcanic activity is one of the main natural hazards and may cause damage to life and infrastructure. Therefore, investigation and monitoring of volcanic activity is crucial in mitigating volcanic risk. Since transport processes in the conduit have a major impact on eruption dynamics, understanding conduit processes is of great interest. Unfortunately, direct measurements of these processes are difficult and one has to rely on remote sensing techniques while observing them.
Due to the high conductivity contrasts between hot magma or hydrothermal systems and the relatively cold and mostly dry host rock, electromagnetic methods are suitable to detect hydrothermal systems or processes within the conduit of an active volcano. The transient electromagnetic method (TEM) is capable of investigating conductivity structures of up to several hundred meters depth. Therefore, this method should be well suited to explore hydrothermal systems and processes within a volcanic conduit.
For exploring the usability of TEM in volcanic environments, we use three-dimensional forward modeling, so-called virtual experiments, on a digital elevation model of Stromboli volcano, Italy. The main purpose is to characterize the nature of electromagnetic fields in complex topographic settings and the vicinity of a magmatic conduit causing a highly conductive anomaly. Consequently, conclusions on the usability of TEM in volcanic environments can be drawn.
Motivated by the computational results, in June 2019 we conducted a field experiment at Stromboli Volcano, Italy, to investigate the feasibility of TEM under field conditions.
The results of the virtual experiments as well as the conductivity distribution resulting from the TEM field data will be presented.
The transport of magma and magmatic fluids is often the key process having the main control on the occurrence, duration and intensity of various volcanic crises. Volcano gravimetry allows for an unequivocal inference of the location and associated mass of accumulated or removed magmatic fluids at volcanoes. This task is best accomplished through collecting gravity time series at multiple stations simultaneously. The performance of individual gravimeters and the configuration of the gravimetric array, however, determine the threshold of detectable mass change and the ability of the array in minimizing the effect of random observation errors on the inferred quantities.
We utilize numerical optimization techniques to design a network of one absolute quantum gravimeter (AQG), two superconducting gravimeters and multiple microelectromechanical system (MEMS) gravimeters at Mount Etna. We also develop analytical solutions for simple design problems. We show that the analytical solutions are essential for validating the numerical optimization procedure. We provide practical details and caveats that must be considered in similar gravimetric network optimizations. These include 1) specifying the target zone of the network by using the eruption history, 2) calibrating the objective functions associated with various optimizations, 3) accounting for logistic and instrumental constraints in the optimizations and 4) incorporating probabilities associated with different parts of the target zone, 5) analyzing the network sensitivities to different target sources in the presence of constraints and 6) calculating the optimal number of gravimeters as a function of the sensor sensitivity and accuracies. We show that due to the existing constraints, surface topography and sensor sensitivities our optimal solution for Mount Etna provides a nonuniform detection power across the target zone. This optimal solution however, provides a minimum level of monitoring for most parts of the target zone and at the same time minimizes the impact of random observation errors on the inferred quantities.
Considering the hazards of volcanic eruptions, especially the influence of volcanic ash on human health and infrastructure incl. aviation, good monitoring systems are important in order to warn the population of dangers at an early stage. Using radar systems it is possible to detect small particles like rain drops or volcanic ash during most weather conditions. To increase the speed and reliability of an eruption notification we implemented a supervised neural network for the automatic detection of eruptions in Doppler radar data recorded at Turrialba volcano in Costa Rica.
We demonstrate that the automatic classification of eruptions, rain and noise in the data is possible with an accuracy of 98 %. For supervised learning, manually labeled radar data from July 2017 to February 2019 is used. Problems arise in the classification of light rain and the precise determination of the beginning and end of an eruption due to ambiguities. Therefore, a high reliability of the monitoring system is only ensured with additional information such as meteorological data or webcam images. In addition to the eruptions reported by national Costa Rican authorities, at least 40 additional eruptions could be found by the neural network between August 2017 and August 2018.
On July 3, 2019 a rapid sequence of paroxysmal explosions at the summit craters of Stromboli (Aeolian-Islands, Italy) occurred, followed by a period of intense Strombolian and effusive activity in July, and continuing until the end of August 2019. We present a joint analysis of multi-sensor infrared satellite imagery to investigate this eruption episode. Data from the Spinning Enhanced Visible and InfraRed Imager (SEVIRI) was used in combination with those from the Multispectral Instrument (MSI), the Operational Land Imager (OLI), the Advanced Very High Resolution Radiometer (AVHRR), and the Visible Infrared Imaging Radiometer Suite (VIIRS). The analysis of infrared SEVIRI data allowed us to detect eruption onset and to investigate short-term variations of thermal volcanic activity, providing information in agreement with that inferred by night-time AVHRR observations. By using Sentinel-2 MSI and Landsat-8 OLI imagery, we better localized the active lava-flows. The latter were quantitatively characterized using infrared VIIRS data, estimating an erupted lava volume of 6.33 ± 3.17 million m$^3$ and a mean output rate of 1.26 ± 0.63 m$^3$/s for the July/August 2019 eruption period. The estimated mean output rate was higher than the ones in the 2002–2003 and 2014 Stromboli effusive eruptions, but was lower than in the 2007 eruption. These results confirmed that a multi-sensor approach might provide a relevant contribution to investigate, monitor and characterize thermal volcanic activity in high-risk areas.
Small steam-driven volcanic explosions are common at volcanoes worldwide but are rarely documented or monitored; therefore, these events still put residents and tourists at risk every year. Steam-driven explosions also occur frequently (once every 2-5 years on average) at Lascar volcano, Chile, where they are often spontaneous and lack any identifiable precursor activity. Here, for the first time at Lascar, we describe the processes culminating in such a sudden volcanic explosion that occurred on October 30, 2015, which was thoroughly monitored by cameras, a seismic network, and gas and temperature sensors.
Prior to the eruption, we retrospectively identified unrest manifesting as a gradual increase in the number of long-period (LP) seismic events in 2014, indicating an enhanced level of activity at the volcano. Additionally, sulfur dioxide (SO$_2$) flux and thermal anomalies were detected before the eruption. Then, our weather station reported a precipitation event, followed by increase of steaming and a sudden volcanic explosion. The multidisciplinary data exhibited short-term variations associated with the explosion, including (1) an abrupt eruption onset that was seismically identified in the 1-10 Hz frequency band, (2) the detection of a 1.7 km high white-gray eruption column in camera images, and (3) a pronounced spike in SO$_2$ emission rates reaching 55 kg s$^{-1}$ during the main pulse of the eruption as measured by a mini-Differential Optical Absorption Spectroscopy (DOAS) scanner. Continuous carbon dioxide (CO$_2$) and temperature measurements conducted at a fumarole on the southern rim of the Lascar crater revealed a pronounced change in the trend of the relationship between the CO$_2$ mixing ratio and the gas outlet temperature; we speculate that this change was associated with the prior precipitation event. An increased thermal anomaly inside the active crater as observed in Sentinel-2 images and drone overflights performed after the steam-driven explosion revealed the presence of a ~50 meters long fracture truncating the floor of the active crater, which coincides well with the location of the thermal anomaly. This study presents the chronology of events culminating in a steam-driven explosion but also demonstrates that phreatic explosions are difficult to predict, even if the volcano is thoroughly monitored; these findings emphasize why ascending to the summits of Lascar and similar volcanoes is hazardous, particularly after considerable precipitation.
The observation of volcanic sulphur dioxide (SO$_2$) emissions enables to monitor volcanic activity by quantifying degassing fluxes of volcanic plumes. Recently applied imaging techniques based on non-dispersive optical remote sensing (SO$_2$ cameras) reach a high spatial and temporal resolution. However, due to the limited spectral information, this technique lacks sensitivity, and selectivity and hence it is limited to high volcanic trace gas emissions and favourable measurement conditions.
We present the first measurements of volcanic SO$_2$ emissions with an imaging Fabry-Perot interferometer correlation spectroscopy (IFPICS) prototype in the UV spectral range.
The principle of IFPICS is to employ a Fabry Perot interferometer (FPI), replacing interference filters as wavelength selective elements. The FPI’s periodic transmission profile correlates with the periodic structure of the SO$_2$ spectral absorbance, significantly increasing the spectral information for its detection. This reduces cross sensitivities (e.g. ozone interference, aerosols, clouds), allowing to use IFPICS also for weaker volcanic SO$_2$ emitters, increasing the range of possible atmospheric measurement conditions, and applying the technique to other trace gas species e.g. bromine monoxide or chlorine dioxide. Furthermore, IFPICS does not require calibration with gas cells since calibration with literature cross section is feasible.
The volcanic SO$_2$ column density distributions obtained at Mt. Etna, Sicily were recorded with 0.2 Hz and 400 x 400 pixels reaching a sensitivity of $1\times10^{-19}$ cm$^2$ molec$^{-1}$ at a detection limit of $3\times10^{17}$ molec cm$^{-2}$ s$^{-1/2}$, which is comparable to existing filter-based SO$_2$ cameras.
Atmospheric ozone plays an important role in the chemistry of volcanic plumes, for instance its photolysis is a source of hydrogen radicals and it oxidises halogen atoms and hydrocarbons. The ozone level inside a plume is therefore a good indicator of turbulent mixing and chemical activity. For instance, already small amounts of halogen oxides can lead to significant or even complete O$_3$ destruction. At the same time O$_3$ is difficult to measure in volcanic plumes due to the interference of other constituents on common O$_3$ measuring devices. In particular, SO$_2$ has a positive interference with the most common technique for O$_3$ measurement, short-path UV absorption. Typically, the interference signal due to volcanic SO$_2$ will exceed the atmospheric O$_3$ signal by one to two orders of magnitude. Therefore, it is difficult to find reliable O$_3$ measurements in volcanic plumes.
Here we present a lightweight (< 2 kg) O$_3$ instrument based on gas-phase chemiluminescence following the O$_3$ + C$_2$H$_4$ (Ethylene) reaction, which is suited for ground based and airborne (drone) deployment. We discuss the detection limit, response time, and possible interferences of the instrument as well as studies made possible by the instrument.
The Network for Observation of Volcanic and Atmospheric Change (NOVAC) monitors the SO$_2$ and BrO emissions of more than 40 volcanoes using scanning UV spectrometers. The volcanic gas emissions are retrieved from the recorded spectra by applying Differential Optical Absorption Spectroscopy (DOAS). We present semi-continuous (only during daytime) time series of the slant column densities (SCDs) of SO$_2$ and BrO as well as of the calculated BrO/SO$_2$ molar ratios in the volcanic gas plume of Masaya (Nicaragua, 12°N, 86°W, 635m a.s.l.) from March 2014 until May 2019. The volcanic gas emissions have been significant throughout the overall period, with most of the time SO$_2$ SCDs of at least 3x10$^{18}$ molec/cm$^2$ and daily maximum BrO SCDs of at least 2x10$^{14}$ molec/cm$^2$. The BrO/SO$_2$ molar ratios varied between 1-10x10$^{-5}$. Two major patterns have been observed in the BrO/SO$_2$ time series: (1) An annual periodicity with an amplitude of about 2x10$^{-5}$ and (2) a step increase in the periodicity corrected data in late 2015 from an annual mean of 2.7x10$^{-5}$ until mid 2016 to 4.1x10$^{-5}$ from late 2015 on (the actual increase is not observed due to a data gap). The step increase coincides with the formation of a shallow lava lake and is thus most likely caused by a change in the magmatic system. A comparison of the BrO/SO$_2$ data with meteorological data from the ECMWF forecast model indicates an anti-correlation between BrO/SO$_2$ molar ratios and the specific humidity (correlation coefficient of -38%) and a similar annual cyclicity as the ozone background concentration (though accompanied by a low correlation coefficient of +17%). The annual periodicity in the BrO/SO$_2$ time series may thus be caused by atmospheric effects. Furthermore, no systematic dependency between the BrO/SO$_2$ molar ratios and the atmospheric plume age has been observed for an age range of 1-12min after the release from the volcanic edifice indicating an early stop of the autocatalytic, partial transformation of bromide solved in aerosol particles to atmospheric BrO (the so called “bromine explosion”). As a possible direct causality, high humidity levels may have diluted the bromide concentration in the aerosols and thus the bromine explosion would have been humidity limited in these cases. Alternatively, the humidity variations may be just a proxy for coinciding variations in other meteorological parameters such as the position of the ITCZ which affects e.g. the ozone background and the irradiation conditions.
Bromine monoxide (BrO) is a halogen radical altering – inter alia – the atmospheric ozone and radical chemistry. High BrO/SO$_2$ ratio was seen at the outer part of the plume, while in the center region of the plume BrO/SO$_2$ ratios were found to be lower. These measurements obtained from ground-based as well as airborne instruments suggest that the formation of BrO – a secondary product of volcanic gas – might be hindered in the center region of the plume, where it is limited by the mixing in of ambient ozone.
Here, we present BrO and SO$_2$ column densities of the volcanic plume of Mount Etna on Christmas 2018 measured by the TROPOspheric Monitoring Instrument (TROPOMI) onboard ESA’s Sentinel-5P satellite using the Differential Optical Absorption Spectroscopy (DOAS) technique. The high spatial resolution of S5-P/TROPOMI (up to 3.5x5.5km²) allows to resolve spatial variation of the BrO/SO$_2$ ratio in the volcanic plume and thus to differentiate between different plume parts. Dense, i. e. SO$_2$ rich parts in the center of the early plume (several 100kms distance from volcanic vent) show low BrO/SO$_2$ ratios in the order of several 10$^{-5}$. The BrO/SO$_2$ ratio increases for the 8-20h older , more diluted plume, where it reaches several 10$^{-4}$ in the center (for distances up to 1500km from the vent). Throughout the whole plume we observe an increase in the BrO/SO$_2$ ratio towards the edges of the plume, where the BrO/SO2 molar ratio is 3-6x10$^{-4}$. These data indicates the relevance of ambient ozone (and free radical) intrusion also for older volcanic plumes thousand kilometer downwind from the volcanic vent.
Volcanic eruptions emit bromine-containing species in varying quantities, with their emission ratio to tracer species such SO$_2$ varying between volcanoes, eruptions, and even phases of an eruptive event.
Although primarily emitted as HBr, bromine within volcanic plumes cycles between species in a series of low temperature chemical reactions which include heterogenous and photolysis steps. Some bromine exists as BrO, a species which can be observed spectroscopically from ground- and satellite-based instruments.
We present modelling results from WRF-Chem Volcano (WCV), a modified version of the three-dimensional regional atmospheric chemistry and transport model WRF-Chem and associated utilities. We have simulated the Christmas 2018 eruptive event of Mount Etna using a nested implementation the model at maximum lateral resolution of 1km. The plume of this eruption was observed remotely by the TROPOMI instrument.
WCV is able to reproduce the bromine explosion and the major features of the satellite observation – including a cross-plume variation in the BrO/SO$_2$ column ratio. We find that variations in the BrO/SO2 ratio are primarily caused by variations in the concentration of ozone. Ozone is consumed by bromine chemistry and is replenished by the mixing in of ozone-rich background air. This creates a zone of low ozone in the core of the plume which is consequently low in BrO and surrounded by a higher-ozone edge with a higher BrO/SO$_2$ ratio.
For the temporal evolution of the plume, we find that the bromine-chemistry of a concentrated emission plume can be divided into four phases, also governed by ozone availability. In the last phase ozone limitation is minimal and the proportion of bromine in the form of BrO (and the BrO/SO$_2$ ratio) is approximately stable. We find this stable regime also with a simulation of a weaker emission plume. These results could facilitate the use of remote-sensing BrO measurements as a means of quantifying total bromine emissions from volcanoes.
Volcanoes are increasingly better monitored around the world. Nonetheless, the detection and monitoring of volcanic ash plumes remains difficult, especially in remote areas. Intense electrical activity and lightning in volcanic plumes suggests that electrical monitoring of active volcanoes can aid the detection of ash emissions in near real-time. Current very low frequency and wide-band thunderstorm networks have proven to be able to detect plumes of large magnitude. However, the time delay and the relatively high number of non-detected explosive episodes show that the applicability of these systems to the detection of smaller (and often more frequent) ash-rich explosive events is limited. Here we use a different type of thunderstorm detector to observe electrical discharges generated by the persistent Vulcanian activity of Minamidake crater at Sakurajima volcano in Japan. The sensors consist of two antennas that measure the induced current due to the change in electric field with time. In comparison to the existing thunderstorm networks, these sensors measure within the extremely low frequency range (1-45 Hz) and can detect lightning up to 35 kilometres distance.
Two detectors were installed at a distance of 3 and 4 kilometres from Minamidake crater and recorded almost continuously since July 2018. Using a volcanic lightning detection algorithm and the catalogue of volcanic explosions compiled by the Japan Meteorological Agency (JMA), the number of electrical discharges was determined for each individual explosive event. The JMA gives an approximated time for the onset of the eruption, which was compared to the start of electrical discharges.
Preliminary results show that the detector closest to the crater had the highest detection efficiency. It detected electrical discharges during 60% of the eruptions listed by the JMA. This is significantly higher than for the sensors of the World Wide Lightning Location Network, which detected electrical discharges within 20 kilometres of Sakurajima for less than 0.01% of the listed eruptions. Furthermore, for 40% of the detected eruptions, electrical discharges were detected before the estimated time of onset given by the JMA. Hence, electrical discharges can mark the inception of the explosion with a higher precision and are an indication of ash emission. This demonstrates the value of the cost-effective sensors used here as a monitoring tool at active volcanoes.
The question about the origin of life and the emergence of the first organic molecules is still unraveled. Lightning has been considered as a potential energy source for the emergence of life or alternatively as a potential energy source for the synthesis for first organic molecules. One of the most prominent abiotic synthesis experiments are the discharge experiments performed 1953 by Miller and Urey [1] under simulated reducing atmosphere conditions. The presence of volcanic ash has been largely neglected in this early study and in addition new theories about the composition of the Early Earth’s atmosphere have been developed.
Volcanism associated with volcanic lightning provides a possible energy source, a variety of different, including reducing volcanic gases and possible catalysts to synthesize a variety of primitive organic molecules. Volcanic ash particles are known for their porosity, high surface area and high surface reactivity. During explosive volcanic eruptions, the occurrence of volcanic lightning has frequently been observed. Recent laboratory studies successfully recreated volcanic lightning under laboratory conditions [2,3]. As main mechanisms for the electrification of ash particles within volcanic plumes and laboratory experiments triboelectrification and fractoemission were identified [2,3,4]. Volcanic plumes themselves provide a high variety of volcanic gases including, but not limited to reducing ones, and therefore may enlarge the spectrum for possibly available gas compositions in the Early Earth exposed to volcanic lightning.
Over the last decades new theories about the composition of the Early Earth’s atmosphere have been developed. This calls for a new series of discharge experiments including more oxidizing or slightly reducing atmosphere conditions in the presence of volcanic ash.
We will present first insights from volcanic discharge experiments under different atmosphere compositions, varying in CH$_4$, H$_2$S, CO$_2$, CO and H$_2$O composition to mimic some first Early Earth conditions. Special focus is given to the role of ash particles as catalysts and compartment provider and the variety and influence of gas composition on the yield of organic compounds.
[1] Miller, S.L. (1953). A production of amino acids under possible primitive earth conditions. Science,117,528-529.
[2] Cimarelli, C., Alatorre-Ibargüengoitia, M.A., Kueppers, U., Scheu, B. and Dingwell, D.B. (2014). Experimental generation of volcanic lightening. Geology,42,79-82.
[3] Gaudin, D. and Cimarelli, C. (2019). The electrification of volcanic jets and controlling parameters: A laboratory study. EPSL,513,69-80.
[4] James, M.R., Wilson, L., Lane, S.J., Gilbert, J.S., Mather, T.A., Harrison, R.G. and Martin, R.S. (2008). Electrical charging of volcanic plumes. Space Science Reviews,137,399-418.
Volcanic activity is usually connected to volcanic gas emissions. Observations of volcanic gas plumes could thus provide important information for studying the magmatic system and for risk assessment. Sulphur dioxide (SO$_2$), being directly emitted by volcanoes, and bromine monoxide (BrO), which is a secondary product from volcanic emissions of hydrogen bromine (HBr), are constituents of volcanic plumes and are good tracers to quantify volcanic degassing fluxes and degassing parameters. The network for observation of volcanic and atmospheric change (NOVAC) provides data for remote sensing of SO$_2$ and BrO slant column densities (SCD) via differential absorption spectroscopy (DOAS). We here present recent advances in the Heidelberg evaluation algorithm for BrO/SO$_2$ molar ratios in volcanic gas plumes.
The spectroscopes of NOVAC scan the sky from horizon to horizon by recording a spectrum every 3.6°. We apply a DOAS fit to each spectrum of the scan to retrieve SO$_2$ SCDs. The SO$_2$ SCDs within the plume follow roughly a gaussian distribution. We co-add the spectra within its 1-sigma range to a mean plume spectrum. Similarly, we add the 10 spectra with the lowest SO$_2$ SCDs to a mean reference spectrum. Subsequently, more robust SO$_2$ and BrO SCDs are retrieved from these spectra by another DOAS fit. By using the new python based software HEIDOAS, the runtime of the retrieval algorithm is significantly shorter compared to the traditional DOASIS software. This allows to retrieve wavelength dependent instrument line functions from the NOVAC data. Using these data, we can further improve the BrO and SO$_2$ SCD retrieval. Furthermore, the convolution of high resolution trace-gas absorption cross-sections with the instrument line function can be executed as part of the DOAS fit, thus making approximations unnecessary, which are usually made in traditional DOAS with the software DOASIS. We evaluate data of Masaya and compare the results of HEIDOAS with traditional DOAS results.
When volcanic gases enter the atmosphere, they encounter a drastically different chemical and physical environment, triggering a range of rapid processes including photochemistry, oxidation, and aerosol formation. These processes are critical to understanding the reactivity and evolution of volcanic emissions in the atmosphere yet are typically challenging to observe directly due to the nature of volcanic activity. Inferences are instead drawn largely from observations of volcanic plumes as they drift across a crater’s edge and further downwind, and the application of thermodynamic models that neglect reaction kinetics as gas and air mix and thermally equilibrate. Here, we foreground chemical kinetics in simulating this critical zone. Volcanic gases are injected into a chain-of-reactors model that simulates time-resolved high-temperature chemistry in the dispersing plume. Boundary conditions of decreasing temperature and increasing proportion of air interacting with volcanic gases are specified with time according to an offline plume dynamics model. In contrast to equilibrium calculations, our chemical kinetics model predicts that CO is only partially oxidized, consistent with observed CO in volcanic plumes downwind from source. Formation of sulfate precursor SO$_3$ at SO$_3$/SO$_2$ = 10$^{-3}$ mol/mol is consistent with the range of reported sulfate aerosol to SO$_2$ ratios observed close to crater rims. High temperature chemistry also forms oxidants OH, HO$_2$, and H$_2$O$_2$. The H$_2$O$_2$ will likely augment volcanic sulfate yields by reacting with SO$_2$(aq) in the cooled-condensed plume. Calculations show that high-temperature OH will react with volcanic halogen halides (HBr and HCl) to yield reactive halogens (Br and Cl) in the young plume. Strikingly, high-temperature production of radical oxidants (including HOx) is enhanced by volcanic emissions of reduced gases (CO, H$_2$, and H$_2$S) due to chemical feedback mechanisms, although the kinetics of some reactions are uncertain, especially regarding sulfur. Our findings argue strongly that the chemistry of the hot near-source plume cannot be captured by equilibrium model assumptions, and highlight the need for development of more sophisticated, kinetics-based, high-temperature CHONS-halogen reaction models.
The correlation between the erupted mass and the height of volcanic eruption columns has been studied for quite some time. However, a recent study found, that the pulsing of an eruption also has an influence on column height and that certain types of pulsing behaviour can create higher eruption columns than non-pulsed eruptions even if the erupted mass is equal or even less. I am looking deeper into this matter, using the numerical model PDAC (Pyroclastic Dispersal Analysis Code). With PDAC I run 2D axisymmetric simulations. I create different forcing-functions (functions that modulate the velocity of pyroclasts and gas exiting the vent) as inputs to the model. So far my results confirm the findings of L. Scharff (2012). I found that subsequent pulses with declining amplitudes can – at certain inter-pulse-times – create higher eruption columns than pulses of the same form and duration where the amplitudes of each pulse are as high as the maximum of the declining pulses. Furthermore I found that the shape of the forcing function also seems to have an influence on the eruption column height. Currently I’m running simulations to compare the pulsed eruptions to eruptions without pulsing (practically one single pulse similar in shape to the other pulses) that have the same erupted mass and maximum-forcing. To find an explanation for the observed behaviour I calculate the vorticity of the velocity field. In the vorticity I expect to find differences in the eruption column dynamics, i.e. the evolution of vortex-rings being favoured in some setups and hindered in others. Dynamics like that have been studied in the context of optimizing transport processes in industrial settings (thrust augmentation) and might possibly be applied to volcanic settings. To better detect structures in the vorticity-field I plan to use image-processing techniques, i.e. wavelet-transformations.
During its flight a volcanic particle experiences huge ranges of temperatures and chemical environments. To constrain the chemical and physical processes acting on this particle, we need to know its flight path.
I studied 30 events measured by Doppler radar at Volcán de Colima, Mexico. From these I investigated the particle path of one event on 7th February 2015 at 15.15 UTC using additional wind data, photos and videos. Creating a model, assuming a strong plume and an inclined settling path, I estimated plume heights from the radar data. From wind data I used the wind velocity towards the radar beam and with video data I assume an approximately realistic ascent velocity. The calculation results in up to 3470 m. This maximum height fits quite well to a photo of this event (made by M. Rietze) with a plume height of 3760 m. Comparing these results to Bursik et al. (1992), who defined four particle classes, this model would fit to their second particle class, ranging from 2-10 cm. Those particles fall out at the side of the plume column, so the maximum height value is a hint for the real plume height. Additionally, assuming terminal settling velocity as the downward particle velocity component, I calculated the radius of the particles (i.e. “impact law” of Dellino et al., 2005). Assuming a drag coefficient of Cd = 1.2 (calculated out of a table from Dioguardi and Mele, 2015) gives particle radii of up to 1.6 cm, which is of the same magnitude as the particles in class 2.
This shows the possibility of inferring a particle path from radar data. However, there are more studies needed, because out of 30 events, I have only one event with visual verification (one photo).
Reliable chronologies of volcanic eruptions are vital for hazard analysis, but da-ting of Holocene and Late Pleistocene volcanism poses a major challenge. Estab-lished techniques such as 40Ar/39Ar are often problematic due to the long half-life of 40K or the absence of datable materials. In this context, luminescence dating is a promising alternative.
Luminescence signal resetting during volcanic activity can be caused by heat (lava, contact to lava), light (disintegration of ejecta) or (temperature-assisted) pres-sure in the course of phreatomagmatic explosions. While volcanogenic minerals forming volcanic rocks are less suitable for luminescence dating due to anomalous fading, the signal of volcanogenically heated or fragmented country rock also relates to the time of eruption and further provides more accurate results, due to the pres-ence of minerals like quartz.
This contribution aims to illustrate the potential of this latter approach by pre-senting two case studies. The first refers to two Late Pleistocene scoria cones in the Westeifel Volcanic Field (WEVF), Germany, of which the Wartgesberg locality was dated by 40Ar/39Ar and 14C, while the closeby Facher Höhe is chronologically poorly constrained [1]. The former locality allows testing the accuracy of various lumines-cence techniques (TL, OSL, IRSL) applied to quartz and polymineral separates against independent age control. The other study site is the monogenetic Lake Nyos Maar, which is part of the Cameroon Volcanic Line (CVL). Previous dating efforts of the last explosive activity are inconsistent and yielded age estimates ranging from 400 a (14C) to >350 ka (K-Ar) [2].
Our results demonstrate that multiple luminescence methods (TL, OSL) yield equally valid age estimates averaging to 33.6 ± 2.4 ka for the Wartgesberg site, which is in good agreement with 40Ar/39Ar and 14C results. The Facher Höhe, how-ever, is much younger than previously assumed with an average TL age of 15.5 ± 1.1 ka. This southeastern part of the WEVF thus hosts many of the most recent eruption sites, which has important implications for modelling the causes and timing of Eifel volcanism and assessment of future eruption locations. Luminescence stud-ies for the Nyos Maar suggest that the phreatomagmatic explosion has completely reset the inherited TL signal and an average maximum age of 12.3 ± 1.5 ka roughly fits with U-series age estimates [2], indicating that TL is a viable tool for completing the fragmentary chronostratigraphic record of the CVL.
References
Stromboli volcano in Italy is one of Europe’s most active volcanoes, well known for its almost continuous eruptive activity. In the past decades, activity was characterized by explosions of mild to moderate intensity, emitting ash, lapilli and bombs several times per hour. At times, this activity is interrupted by more explosive paroxysms with larger erupted volumes and greater dispersal of eruptive products.
Most of the activity is limited to the crater terrace at 750 m above sea level. The number of active vents varies strongly and every explosion has the potential to change the morphology of the crater terrace. Depending on the size of the eruption these changes range from accumulation of pyroclasts, changing vent and/or crater geometry to a complete re-modelling of the entire crater terrace.
Here, we present high resolution data acquired by structure from motion photogrammetry to illustrate changes on different spatial and temporal scales. Oblique and orthophotos were acquired during several field campaigns to Stromboli in September 2017, October 2018, May 2019, June 2019 and September 2019. Our data comprise morphology changes from ‘normal’ activity, individual major explosions and the two paroxysms in July and August 2019.
Quantitative comparison of such high-resolution UAV data (up to 3 cm/pixel) at volcanoes with significant morphology changes is challenging and requires special processing. Eventually, comparison of topography and accordingly deposited/removed volume provides invaluable information to enhance our understanding of volcanic processes at Stromboli volcano. The observed crater and/or vent geometry changes are important input parameters for scaled laboratory experiments that investigate gas-particle jet dynamics.
Explosive volcanic eruptions are comparably short-lived events with potentially catastrophic consequences and long-term impact. The paroxysmal eruption at Stromboli volcano, Italy, on 3 July 2019 has shown that sudden shifts in eruptive activity can to date not be forecasted. This shortcoming impedes adequate volcanic hazard assessment.
In an attempt to increase our mechanistic understanding of the physical processes related to explosive activity, we have registered acoustic and pressure signals with 2 sets of different sensors: 1. Drone-deployed, custom-made sensors in the direct vicinity of the eruptive vents as well as next to a temporarily installed infrasound array; 2. Permanently installed infrasound array. The drone-deployed sensors recorded temperature, humidity, electric potential, pressure, and sound. As most eruptions took place from the SW and central vents, the temporarily deployed infrasound sensors were positioned on the Fortini ridge (150-250 m distance). The permanent infrasound array is located at Roccette at approx. 550 m distance.
The displayed explosive activity ranged in intensity, duration, and ash content. Close observations allowed for a complete correlation of time, duration, and source vent of >100 explosions. Selected Strombolian explosions were analysed for the distance-dependent acoustic and pressure signals to allow for 1) revealing the radial dissipation of signals from explosive eruptions, 2) better constraining conduit conditions (depth, open/closed), and 3) correlating these features to different types of explosive events. We find substantial differences in the values recorded for a single explosive event as a function of distance from the vent and pyroclast content. Laboratory experiments with instantaneous gas-particle jets at known source and path conditions allow for empirical relationships of source and path conditions, ash content and monitoring signal. Enhanced understanding of the spatial shift of the acoustic signal produced by explosive eruptions will increase the reliability of volcano monitoring based on long(er) distance measurements.
In recent years, unmanned aerial vehicles (UAVs) have developed into powerful tools for volcano monitoring. Particularly valuable during an eruptive crisis, they facilitate observations without the need for scientists to enter hazardous areas. Here, we present the utilisation of vertical take-off and landing (VTOL) drones for emergency management at Stromboli volcano, Italy, that experienced two paroxysms in summer 2019. UAVs provide a low-cost method to safely and quickly obtain updated topographic and thermal maps of the volcano, which can be used to assess the situation and determine morphological changes due to the eruptions. The obtained georeferenced digital elevation models (DEMs) have resolutions up to 0.2 m and serve to obtain eruption volumes by comparison to pre-paroxysms DEMs.
Current approaches to vent opening forecast produce probabilistic maps on the base of the spatial density of past eruptive vents, as well as the surface distribution of structural features such as faults and fractures. One of the main challenges in forecasting future vent locations in the case of distributed volcanism is that we usually deal with scarce, spatially scattered data to support these approaches. As sophisticated as our statistical analysis can be, such data are difficult to interpolate between and extrapolate from, resulting in spatially coarse forecasts and large uncertainties. More recently, Rivalta et al. (2019) proposed a forecasting strategy to predict future vent locations, combining the physics of magma transport at depth (where magma trajectories are assumed to be driven entirely by stress) with a Monte Carlo inversion technique for key stress parameters. This method has been first tested on the Campi Flegrei caldera; however, further validations and development are needed. Here we validate the strategy of Rivalta et al. with data from analog models (air injection in gelatine). We stress a gelatine block in controlled conditions (extension/compression, surface loading/unloading, layering) and observe air-filled crack trajectories. With these data, we test a flavour of the strategy that combines boundary element magma trajectory calculations with a Monte Carlo Markov chain approach. We find the scheme is able to retrieve the parameters of the stress imposed on the gelatine and forecast subsequent vents in the same experimental setups. We also discuss how it may be applicable to natural cases, and what data are necessary for the approach to be feasible.
Geodetic measurements have been employed to investigate surface deformations related to volcanic activities in many locations worldwide. As part of these endeavours, for now more than 100 years, tiltmeters have been successfully applied. As recent studies document that relatively small but significant, deep seismic signals can be detected in the East Eifel Volcanic Field, we suggest the employment of small tiltmeter arrays at selected points, embedded in multiparameter stations. It is envisioned to record quasi-continuous tilt data over the period of a few years to obtain adequate coverage in time in regard to define baselines, map the current situation, as well as to recognise and to interpret potential changes and to potentially detect long-term deformation. Based on the planned measurements with high resolutions of μrad to nrad, it is expected to observe the adjacent, slightly overlapping frequency range of surface deformation in reference to seismic signals. Tiltmeter investigations can therefore act as a link between seismic findings and further scientific endeavours, namely (a) studies operating on much longer wavelengths, e.g., gravity and gas monitoring, and (b) techniques covering larger spatial dimensions, e.g., GNSS and InSAR. The presentation will include new tilt data obtained in an underground laboratory backing the feasibility of the aforementioned concept, which can be part of a permanent monitoring programme in the volcanic fields of the Eifel.
The East Eifel Volcanic Field in Germany is an active seismic and magmatic region where monitoring is important for hazard assessment and scientific analyses. Following two unusually deep micro-earthquakes in September 2013 (about 40 km depth), detected at about 10 local stations, an improved seismological recording network was installed to better monitor and locate local seismic events. Together with new permanent recording stations from the Earthquake Service of Rhineland-Palatinate (e.g. borehole station NICK and surface stations GLOK, BEUR, and PYRM) the two partners have actually 24 stations running in the area (17 from KIT and 7 from LGB-RLP).
The motivation was to enhance our understanding of the seismicity, magmatism and dynamics of the volcanic field and the Ochtendung Fault Zone. This seismological experiment is called Deep Eifel Earthquakes Project - Tiefe Eifel Erdbeben (DEEP-TEE). It started in July 2014 in and around the East Eifel Volcanic Field (network centre ca. 50.4N, 7.3E). Phase 1 together with GFZ Potsdam (July 2014 – August 2016) and phase 2 (since August 2016) are described in details. The recordings allow studying the seismicity in many aspects, including the identification of deep low-frequency micro-earthquakes related to magmatic injections below the Laacher See volcano (Hensch et al., GJI, 2019). We thank the GFZ-GIPP and the KIT-KABBA for providing mobile instruments. Part of the data is open and stored at GFZ (doi:10.14470/6C709520).
Explosive volcanic eruptions and pyroclastic flows are characterized by a wide spectrum of particle velocities and locations in the vicinity of the volcano. To measure these velocities and locations we use Frequency Modulated Continuous Wave (FMCW) radar. This is a low power consuming, remotely operable and low cost measurement technique, not affected by cloud coverage or darkness. A 24 GHz electro-magnetic radar wave is reflected from the pyroclastic targets, resulting in a two-tone signal, which is directly related to particle distance and velocities. However, FMCW radar is traditionally only applied for near-field and low velocity targets such as car traffic.
In this work we expand the method to explosive volcanic targets in up to several km distance and velocities of more than 100 m/s. Contrary to established near-field FMCW radar, the far-field targets cause artificial dual targets to appear in the FMCW processing. To solve this challenge, we present a spectral analysis based processing variation, which does not need external information about the pyroclastic event. The method is tested on synthetic single channel data, showing its validity even for most basic data acquisitions. It is part of the development of a volcano-radar prototype for the University of Hamburg.
Preeruptive processes at volcanoes can be observed by various different methods, e.g. tiltmeters, strain meters, or by photogrammetric methods (i.e. imagebased methods to determine shape and position of an object). Here we apply photogrammetric methods to video sequences of eruptions at Anak Krakatoa (Indonesia) from October 2018 to investigate preeruptive deformation processes
in the crater area. Seven eruptions of Anak Krakatoa were filmed in October 2018 using a Mavic Pro drone. The video sequences examined here show the active crater area prior to the December 22 sector collapse. However, only two of the recorded eruptions are usable for a photogrammetric analysis due to unfavorable perspectives or strong preeruptive degassing. In these two sequences the growth of a lava dome can be observed prior to both studied eruptions.
A free research software called EMT (environmental motion tracking) is used for data evaluation. It provides a work flow for the analysis of image sequences including motion tracking, camera motion correction as well as scaling and georeferencing of measured trajectories. I.e., EMT yields displacement values for so-called object points defined within the dynamic area of interest. In case a digital elevation model (DEM) of the studied object is available, it is possible to georeference the tracked object points (i.e. assign them to a position in space) and scale the measured displacement values to metric units.
For one of the eruptions investigated here, a maximum displacement of 4.03m is found, consisting of vertical movement in the major part. Maximum velocity yields to 0.71m/s, while maximum acceleration derives to 5.93m/s$^2$, respectively. The presentation will focus on the details of the work flow as well as the strong textproblems encountered during the processing.
Mount Saint Helens, probably the most famous volcano in the Cascade Volcanic Arc, is located in the southwestern part of Washington State, USA. Characterized by a 2 x 3.5 km horseshoe-shaped and north-facing crater, Mount Saint Helens hosts one of the last expanding glaciers in the Cascade Volcanic Arc. Primarily caused by geothermal activity, an extensive system of firn & glacier caves has developed around the 2004-2008 Lava Dome. These cave systems offer a rare view into the internal workings of a glacier and can lead to a better understanding of how glaciers and active volcanoes interact. Due to cave studies over the last six years it was possible to observe noticeable morphological changes in some cave systems caused by changes of the geothermal system, by extensive glacier movement, and rapid glacier growth. In contrast to studies done inside the former firn caves in proximity of the 1980-1986 Lava Dome around 20 years ago, it is difficult to say if the newly formed system is in balance with the present geothermal heat release.
Between 2014 and 2019 we surveyed 10 caves in detail, with a total length exceeding more than 2 km and the largest system having a surveyed length of almost 540 m. We also calculated cave volumes of more than 145 000 m³. Most of these caves are located above numerous fumaroles which lead to extremely large-scale systems with a vertical extent of up to 73 m. Fumarole temperatures fluctuate during the year, but usually do not exceed temperatures above 90°C. It seems like cave systems can only exist above low-temperature fumaroles. High-temperature fumaroles, like they might appear outside the caves on and around the 2004-2008 Lava Dome, would lead to a complete melting of passages. It also appears that the volcano´s geothermal system is greatly influenced by exogenous factors in terms of rainfall and snowmelt. Compared to constant fumarole temperatures on Mount Rainier, we here can observe continuous changes. But different than the cave systems on Mount Hood, the crater and firn caves on Saint Helens do not show any signs of glacial flooding. Since the caves show diverse characteristics, it is interesting to study the reasons for it and to continue and expand climatologic research during the next years.
Besides climatologic studies, we also plan to focus on fumarole sampling in summer 2020 to obtain representative chemical and isotopic data. Furthermore, different snow and tephra layers which can be seen in almost all caves shall be investigated. In order to get information about environmental impacts we can study pathways from glacial snow and ice to drinking water, or the existence of major and trace elements. It might be also interesting to see in which extent permanent fumarolic activity influences the glacier and in which way former activity is preserved inside the Crater Firn & Glacier Caves of Mount Saint Helens.
Long Valley Caldera (LVC, California) is well-known for its complex geophysical signals that result from an active magmatic system featuring recent episodic inflation, long-term tectonic motion, and associated seismicity. Located at the eastern edge of the Sierra Nevada block, this region is also influenced by hydrological forcing associated with large amounts of precipitation (average annual of ~100 cm/yr) in the Sierra Nevada and its spatiotemporal variability. The instruments measuring deformation in this area, such as Global Navigation Satellite System (GNSS), are therefore recording the effects of superimposed tectonic and non-tectonic processes.
Combining displacement data from permanent GNSS networks with different hydrological records, we analyze the non-tectonic deformation affecting the LVC region and the adjacent Sierra Nevada range. The vertical and horizontal components of GNSS displacement vectors show a clear correlation with hydrological trends at both multiyear and seasonal time scales.
At the seasonal timescale, deformation is largely controlled by the response to hydrological surface loading. However, we detect several GNSS sites mainly clustered in the south/south-western rim of the LVC showing anomalous horizontal deformation that cannot be explained as elastic response to surface load. This is also the area where most of the water recharging the LVC hydrothermal system occurs and where a runoff-induced seismicity has been recently identified. Based on the location of the GNSS sites, the shape and timing of transient seasonal deformation, and its temporal correlation with spring/summer discharge and shallow seismicity rates, we hypothesize that this signal reflects poroelastic deformation in response to surface water recharge into Sierra Nevada slopes.
At the multi-year scale, recent inflation episodes at LVC show a temporal correlation with periods of severe droughts affecting a larger region (Western US). Using numerical modeling (COMSOL software), we investigate the influence of surface water load variation on the LVC magmatic system. Furthermore, we evaluate the effect of geometrical and structural complexities of the area on the deformation pattern related to inflation episodes.
On 10th and 11th July 2015, two successive sequences of PDCs travelled down the south flank of Volcán de Colima. The PDCs buried (and partly destroyed) a monitoring station and its solar panels, so that the surviving parts (batteries and data logger) simply ran out of power the day after and could be recovered later. The solar charging unit contained a thermometer that measured ambient temperature, which was then recorded by the data logger. This thermometer was buried below the sequences of PDCs, now giving a unique time line of the heating and cooling below a PDC.
Seismic data of a nearby seismometer shows the succession of discrete PDCs for 50 min on 10th July and almost 2 hours one day later. The duration of the seismic signals and the heating period nicely correlate, suggesting that most of the PDCs reached the monitoring station at 3km distance from the crater depositing hot material onto the thermometer. The monitoring station was installed on a crest between two runout channels so that the deposited material most likely corresponds to the more dilute upper part of the PDC overtopping from one channel into the other.
Here we make use of simple 1D analytic and numerical finite element models for thermal evolution in heterogeneous media with complex geometries coupled to non-linear inversion algorithms to invert the temperature history recorded by the thermometer for the history of successive deposition events during the sequences of PDCs, their layer thicknesses, and deposition temperatures.
Low-δ18O rhyolites have been a petrological conundrum as they reflect silicic magma generation in the shallow and relatively cold upper crust (<400 °C), a region thought to be unfavorable for the production of large melt volumes. Their genesis is therefore crucial in understanding what keeps large silicic magma reservoirs in the upper crust alive over timescales of millions of years.
Low-δ18O rhyolites along the Yellowstone hotspot track have been interpreted as crustal melts, derived from material that was hydrothermally altered at high temperatures (150-400 °C). Investigation of the hydrothermally altered rock record suggests that alteration does neither significantly change whole-rock compositions nor lead to higher water contents. Simulations by rhyolite-MELTS and partial melting experiments (750-1000 °C, 1-2 kbar) reveal that the lack of hydrous alteration minerals and resulting low water contents hinder melting, suggesting that low-δ18O rhyolites are more likely produced by ~30-40% assimilation of hydrothermally altered silicic rocks into a mantle-derived magma. Experiments show no fractionation of oxygen isotopes during incipient melting, indicating that partial melt inherits the bulk δ18O of the hydrothermally altered source material.
We apply these findings to other occurrences of low-δ18O silicic magmas (e.g. in Australia, Iceland, South Africa, Kamchatka, Nevada), in order to identify general mechanisms for the production of low-δ18O silicic magmas on Earth. Low-δ18O settings can either be linked to assimilation of pre-existing hydrothermally altered crust, or (more commonly) to assimilation of syn-magmatically altered rocks. Assimilation of syn-magmatically altered rocks is promoted in shallow, large-scale, long-lived caldera-forming silicic reservoirs that host extensive high-temperature hydrothermal systems, and produce hot (>800°C) and dry A-type magmas. The apparent scarcity of low-δ18O silicic magmas on Earth suggests that coincidence of these factors is rare, and is most likely encountered in Yellowstone-type systems. The large volumes of 18O-depleted rhyolite in early sections of the Yellowstone hotspot track represent an exceptional case, where both syn-magmatic and pre-existing alteration concur, leading to assimilation of material that was extremely low in δ18O (< -5 ‰).
Plinian eruptions inject gases, aerosols, and fine ashes into the stratosphere, potentially influencing climate. The amounts of volatiles emitted from such eruptions are typically estimated using the difference between contents in silicate melt inclusions formed at depth and those in the groundmass of glassy tephras (the so-called petrologic method). We have compared chlorine emission data obtained by the petrologic method from Plinian eruptions along the Central American Volcanic Arc (CAVA) from Kutterolf et al. (2013, 2015) with data obtained from magmatic fluid inclusions in the same samples.
The average composition of the pre-eruptive fluid phase from silicic CAVA eruptions amounts to 90 wt% water, 5 wt% CO$_2$ and 5 wt% NaCl equivalents, and show little systematic along-arc variations. The pressures obtained from the earliest fluid inclusions range between 150 and 400 MPa for the various eruptions. The occurrence of magmatic fluid inclusions provides evidence for pre-eruptive criticality of all volcanic systems at such pressures, and correspond to water contents in the magmas between about 4 and 8 wt% at depth. Taking into account the fluid phase salinity of each eruption, and assuming complete degassing during eruption, the chlorine budgets obtained from fluid inclusion data typically match very well those obtained by the petrologic method. For some eruptions, however, emissions of a pre-eruptive fluid phase may have significantly contributed to the volatile budget. Similar data from other large eruptions may be used to significantly revise the emission budgets.
Kutterolf S, Hansteen TH, Appel K, Freundt A, Krüger K, Peréz W, Wehrmann H (2013), Geology, doi:10.1130/G34044.1
Kutterolf S, Hansteen TH, Freundt A, Wehrmann H, Appel K, Krüger K, Pérez W (2015), Earth Planet Sci Lett 429: 234-246, doi:10.1016/j.epsl.2015.07.064
The 5$^{\rm th}$ international Vulcano Summer School was a great opportunity to collect spectral data in an environment characterized by a large variety of volcanic and hydrothermal altered products. Our main goal was to investigate the in situ spectral response of a vast assortment of volcanic and hydrothermal deposits and compare these results with data collected in laboratory experiments. The Vulcano island was a perfect location for collecting data on several volcanic products characterized by a wide range of composition from basalt to rhyolite and considering also the products of Sulphur produced in the fumaroles area. In order to collect results considering the chemistry and the mineral contents we used a combination of three instruments. For investigating the mineralogical content, we performed measurements with a portable spectro-radiometer (PSR+3500) which collect results in the visible and near infrared spectral range (350 – 2500 nm) with a spot size of 3 by 3 mm. Moreover, we used a RaPort handheld Raman instrument by EnSpectr equipped with a 532 nm (same wavelength as used for the ExoMars2020 rover mission). The in situ chemical analysis were performed with a commercial handheld LIBS instrument (SciAps Z 300) which uses a laser to ablate a small amount of sample material and to produce a plasma spark whose spectral analysis permits rapid multi-elemental analysis in the field. The preliminary analysis of the acquired VIS/NIR spectra in comparison with the spectral libraries provided by PDS (https://speclib.rsl.wustl.edu/) implies a remarkable enrichment in alteration minerals in this area. So far, next to iron bearing oxides and clay minerals, several sulfates could be identified. The spectra analyzed show a nice transition from more iron-bearing lava blocks to material dominated by sulfates such as Alunite and Jarosite. Both minerals appear to be rich in K in the studied area, which was also seen in the LIBS data. The handheld Raman spectroscopy confirmed the VIS/NIR data for mineral recognition and was also able to identify traces of biomolecules such as carotenoids on the colonized rock surfaces, which are of highest interest for the characterization of the habitability and the search for life on Mars. This survey is a key point for testing the instrument responses in an environment which is a potential analogue of Mars. Therefore the investigated area provides a unique training ground for instruments and techniques foreseen for future robotic missions to Mars (e.g. Mars2020 and ExoMars2020 rovers).
Rising magmas are subjected to volatile exsolution due to decompression, which induces bubble nucleation, growth and coalescence. Although degassing strongly depends on melt and volatile composition, similar magmas can feed eruptions with different degree of explosivity, which in turn appears to be well-correlated with decompression rate. A better knowledge of volatile degassing mechanisms holds the key to improve the understanding and forecasting of hazardous events related to explosive volcanism.
Solubility and decompression experiments were performed on a synthetic, leucititic composition from the Pozzolane Rosse eruption of the Colli Albani Volcanic District.
Solubility experiments were conducted in an internally heated pressure vessel at 1250°C, at intrinsic redox conditions (log f$_{\rm O2}$= NNO+3) and pressures of up to 300 MPa with molar fractions of water of 0, 0.2, 0.4, 0.6, 0.8 and 1. Results show that the solubility of water is increasing with pressure from 3.74 wt% at 100 MPa to 7.29 wt% at 300 MPa, whilst CO$_2$ solubility varies from 2940 ppm at 100 MPa to 8460 ppm at 300 MPa.
Decompression experiments were performed at 1250°C using an internal heated pressure vessel equipped with a continuous decompression system. In a first step, H$_2$O-CO$_2$ saturated melts with X$_{H2O}^{fl}$ of 1, 0.5, 0 were synthesized at 200 MPa for approx. 4 days. The quenched glasses were crystal and bubble free. They were cut into smaller sections and again encapsulated under vacuum into Au$_{75}$Pd$_{25}$ capsules for the decompression experiments. Prior to the decompression, the samples were maintained at an initial pressure of 200 MPa and 1250 °C for approx. 4 days for re-equilibration. Then, a relatively fast decompression rate (1 MPa/s) was applied to bring the system to a final pressure of 150, 100, 50 or 30 MPa and immediately drop quenched to a glass. The 2D structure of the experimental products was investigated with SEM, whilst the volatile content of the glass/melts was analyzed using FTIR spectroscopy.
First results show that CO$_2$ is the first volatile to exolve with a supersaturation pressure below 100 MPa. Comparing our solubility data with the volatile contents of the decompressed glasses, we suggest that the degassing happens at disequilibrium conditions, with water being trapped in a metastable state in the melt.
Mid Ocean Ridge Basalts (MORBs) represent the most abundant magmatic composition on Earth. Yet, their rheology had not been extensively experimentally investigated so far, hindering our ability to attain quantitative models of their emplacement processes. We thus obtained a series of detailed measurements on the rheology of a mid-ocean ridge basalt representing the average composition of MORB melts worldwide. The investigated sample was dredged from the South Mid-Atlantic Ridge during the 1998 RV Meteor cruise M41/2, and is catalogued as 139-KDS-2. In order to characterize the sample rheology, we ran high temperature, controlled oxygen fugacity experiments in a concentric cylinder rheometer mounted on a tube furnace. Reducing conditions compatible with natural scenarios were imposed on all experiments. Liquid only experiments spanned the temperature range comprised between 1530 °C and 1160 °C, and revealed low viscosities of 2.2 Pa s to 58 Pa s. Additionally, three subliquidus experiments were conducted on samples crystallized at the equilibrium temperatures of 1149 °C, 1139 °C, and 1129 °C. Apparent viscosity values increase from 1206 Pa s at 1149 °C to 1678 Pa s at 1129 °C for a constant strain rate of 0.52 s$^{-1}$. Likewise, apparent viscosity values were determined for a range of strain rates. Crystal fraction increases with decreasing temperature, driving the observed viscosity increase as well as prompting shear thinning behavior. Quenched post-experimental samples were recovered for quantitative textural analyses.
Submarine hydrothermal systems sustain unique ecosystems, affect global-scale biogeochemical ocean cycles, and mobilize metals from the oceanic crust to form volcanogenic massive sulfide deposits. Understanding and quantifying the involved processes requires linking seafloor observations to physico-chemical processes at inaccessible depth; here numerical models of hydrothermal circulation within the oceanic crust can be particularly useful.
Numerical modelling of seawater phase transitions and the subsequent multi-phase flow in high-temperature submarine hydrothermal systems is challenging, because of (1) the wide pressure-, temperature-, and composition-ranges, (2) the complexity of the equation-of-state for saltwater with highly non-linear thermodynamic properties, and (3) the strong coupling between the conservation equations describing the multi-phase flow. All existing numerical studies have been restricted to two dimensions.
Here we present novel 2-D and, for the first time, 3-D numerical models for submarine hydrothermal systems, which use the Finite Volume Method on unstructured meshes in combination with the Newton-Raphson Method for solving the strongly coupled equations. We study seawater phase transitions in response to variations in magmatic energy input and find that initially low-salinity venting occurs during periods of high basal heat fluxes. The venting fluid is a mixture of seawater and phase-separated vapor, while the vapor’s counterpart accumulates as a dense, high-salinity brine layer at the base of the hydrothermal system. This brine layer limits the heat flow into the overlying convection cell so that phase transitions diminish over time and vent fluid salinity returns to seawater-like values. When the magmatic heat source vanishes, the cooling brine layer is successively entrained into the overlying seawater convection resulting in a higher vent fluid salinity. First 3-D results indicate more complex spatial and temporal variations of vent fluid salinity along the ridge axis.
For the past decades, several numerical studies have successfully reproduced the concentric uplift pattern observed above the Altiplano-Puna Magma Body (APMB) in the central Andes. However, the temperature- and strain rate-dependent viscoelastoplastic rheology of rocks, the buoyancy of magma, the effects of modelling in 3D as well as the shape of the magma body have often been simplified or neglected.
Here, we use a joint interpretation of seismic imaging and gravity anomalies to constrain location, 3D shape and density of the magma body. With the help of the thermo-mechanical finite difference code LaMEM, we then model the surface deformation and test our results against observations made by Interferometric Synthetic-Aperture Radar (InSAR) missions. This way, we gain insights into the dynamics and rheology of the present-day magmatic system and can test how a change to the current conditions (e.g., magma influx) could impact it.
We find that only an APMB with a maximum thickness of 14 to 18 km and a corresponding density contrast to the surrounding host rock of 100 to 175 $\mathrm{kg/m^3}$ satisfies both tomography and Bouguer data. Based on that and the chemistry of eruption products, we estimate the melt content of the APMB to be on the order of 20 - 25%. We also find that the observed uplift can be reproduced by magma-induced buoyancy forces without the need for an additional pressure source or magma injection within the mush, and that the geometry of the top of the magma body exerts a major control on the deformation pattern at the surface.
The Strombolian eruption style, named after Stromboli volcano (Italy), can be attributed to large gas slugs that coalesce from exsolved gas bubbles during their ascent inside the volcanic conduit. Moreover, field observations at the vent reveal that eruptions consist of pulses on the order of a few seconds. One possible explanation for this behaviour is a constricted conduit through which the slug has to squeeze, at which point smaller bubbles separate from the main slug. In this study, a commercial CFD software is used, and a custom non-linear viscosity model is implemented, to shed more light onto this hypothesis. We carry out systematic, cylinder symmetric model calculations to explore the conditions of gas slug disintegration in the case of a non-newtonian rheology. In a conduit of 3 m diameter and 150 m length we found that a numerical resolution of 3 cm or less is necessary to achieve a meaningful solution. We find that a gas slug of 100 kg water vapor will be disintegrated into 18 separate smaller slugs. Further results will be discussed and because this problem is highly non-linear, numerical solutions are sometimes difficult to attain. The numerical problems encountered during this work will also be discussed.
In theory, pockets of fluid in brittle media can be transported large distances, provided that both the fluid volume is large enough, such that fluid pressures can fracture the rock, and that stress gradients exist causing asymmetric growth of the fracture's front. Currently, industrial injections are deemed safe based on empirical observations of volumes, rates and pressures from closed-access industrial data. Existing theoretical models are difficult to use a priori to predict the critical volume of fluid that will cause unhindered fracture ascent, as they are expressed in terms of the fracture’s length, which is hard to predict a priori and difficult to measure. Here we constrain scale-independent critical volumes as a function of only rock and fluid properties by supplementing simple analytical models with numerical simulations in three dimensions. We apply our model to laboratory and natural settings, showing that the volumes we estimate match well with laboratory data and can be used as a conservative estimate in geological applications.
Volcanoes may erupt dominantly at their summit or on their flanks, depending on a number of reasons including edifice shape, magma composition, tectonic setting. At calderas, which lack a summit to focus ascending magma, eruptive vents are often scattered within or around the caldera rim, distributed in patterns that may have shifted over the history of the volcanic complex. The scattered nature of vent patterns means that volcanic hazards affect vast areas; forecasting the future vent opening location are a necessary input to hazard models. Generally, forecasts are produced in a data-driven way, based on the distribution of previous vents. However, the small number of vents on which to rely on, their low spatial density and any shift of vent patterns in time make forecasting of future vents difficult to asses.
Here we show that magma pathways, and thus future vent locations, may be forecasted based on the physics of magma transport by dyking, whose propagation direction is controlled by stresses. We combine stress-controlled trajectory simulations with a Monte Carlo inversion scheme for the stress history of the volcano, constrained by the location of past vents, to define a probabilistic stress model for the volcano. Trajectories and vent location for future eruptions can then be forecast based on such probabilistic stress model.
We apply our new approach on Campi Flegrei (Italy). We find that observed shifts in vent patterns are controlled by a delicate balance between regional/local stresses and the stresses induced by surface loads (including topography and volcanic deposits), which at most volcanoes varies in time due to eruptive activity. The resulting stress balance governs the curvature of the trajectories of ascending dykes and thus the location of future vents. Our method offers a mechanical explanation for the vent clustering and migration observed over the successive eruptive epochs at Campi Flegrei.
One of the main compounds emitted by volcanoes or volcanic fields is CO$_2$. This is not only emitted from localized craters, but can emerge as distributed and fugitive emissions on extended volcanic areas. In this situation it is of interest to explore the distribution and horizontal concentration profiles of the CO$_2$-emissions.
For this purpose new drop-sondes for sensor measurements of CO$_2$ emissions are under development at the Duesseldorf University of Applied Sciences. These drop-sondes are designed to be dropped from aircraft or drones over volcanic areas in order to map the distributed CO$_2$ concentrations over longer times in an unattended way. They are very lightweight and cheap, so that a large number of drop-sondes might be deployed even over remote areas or regions with difficult access. The data are transmitted with GSM broadcasting and can be visualized on a geographical map.
The drop-sondes use an NDIR CO$_2$ sensor as a base for the measurement unit. Additionally to CO$_2$ the atmospheric pressure, temperature and humidity are measured. The sensor unit is mounted in a special shock absorbing housing, which is designed to absorb impacts from the touch down after dropping of the sensor and is able to resist even adverse weather conditions.
First measurement results and more details of the design of the sensor unit will be presented in this contribution.
A 10 x 10m subarea of a hot and heavily CO$_2$ emitting mofette on a hilly grassland at Caldeiras da Ribeira Grande, located on the north flank of Fogo Volcano, was studied. A 1 x 1m grid was laid on top of the area and at each intersection, soil gas measurements were performed at three different depths. CO$_2$, CO and O$_2$ were measured. In addition, soil CO$_2$ flux using the accumulation chamber method was measured and soil cores were taken at each grid intersection at a depth of 7-13cm as this depth was thought to reflect the main rooting horizon of grasses and herbaceous plants in that area. Soil water content, soil pH, conductivity and organic matter were determined. Quantitative vegetation analysis was carried out and total number of plant species as well as species total and individual coverage were estimated in each square.
Carbon dioxide was emitted in 4/5 of the total area and only 20m$_2$ showed no or a low CO$_2$ emission. Only the upper horizontal part of the mofette showed CO$_2$ background values in the upper soil horizon. The lower part of the area was strongly CO$_2$ emitting, with CO$_2$ concentrations reaching 90-100% at the left lower part of the area. Oxygen values inversely corresponded to the CO$_2$ concentrations. Overall, CO$_2$ values increased with depth, whereas O$_2$ decreased. Soil CO$_2$ fluxes mirrored the CO$_2$ concentrations to a large extent.
In addition, soil temperature mirrored CO$_2$ concentrations. Temperatures were close to ambient in the upper one-third of the area where CO$_2$ was low; temperature increased even in the upper soil horizon in the lower 2/3 of the area, where CO$_2$ emission was high. Also, temperature increased with soil depth but was 70°C even at only 20cm soil depth. Two dominant high temperature spots were found at the lower part of the mofette; a lower temperature “channel” divided the spots.
Total plant coverage showed a “Y” shape in the lower 5m of the area. Plant coverage was close to 100% all over the area except at those parts where soil temperature, soil CO and soil CO$_2$ concentrations were high (40-70°C). Interestingly, plant species number was lowest on low CO$_2$ emitting soils; between one and four species grew at these sites (2-12% CO$_2$). On higher emitting and warmer soils, species number slightly increased. Up to 13 different species were counted.
Two grasses, namely Lolium perenne (perennial ryegrass) and Holcus lanatus (meadow soft grass) grew only on cooler, low-CO$_2$-emitting sites; they thus reflect thermophobic and mofettophobic plant species (Pfanz et al. 2004, 2019). Cyperus esculentus (earth almond), Kyllingia brevifolia (shortleaf spike sedge), and Oxalis corniculata (creeping wood sorrel) proved to be highly thermophilic . These species also proved to be mofettophilic as they also tolerate quite high CO$_2$ concentrations in their rooting horizon.
As in other places with CO$_2$ emissions at ambient temperatures, also in hot and CO$_2$ emitting sites, plants can be found that indicate high CO$_2$ emission (mofettophiles) or high temperatures (thermophiles). In our case also thermo-mofettophiles were found.
The Santiaguito volcanic dome complex, Guatemala, has been continuously active since its formation in 1922 at the flank of Santa Maria’s eruption crater. Over time, four volcanic domes formed of which only the oldest one, Caliente, is still active today. Santiaguito’s, or more precisely Caliente’s, eruptive behavior is characterized by several eruptions a day with varying frequency and rockfalls, pyroclastic flows and lava flows are common. The lava is blocky and the length of the lava flows varies between tens of meters and almost 4km. Santiaguito volcano has been focus of scientific studies for years and the work presented here follows in the footsteps of Ebmeier et. al (2012) who used InSAR (Interferometric Synthetic Aperture Radar) to estimate, amongst other things, lava thickness and flow shape between 2000 and 2009.
In the present work, we use TanDEM-X satellite data, between September 2011 and April 2019, to generate digital elevation models of Santiaguito to determine elevation changes and perform associated volume estimates of lava flows. The digital elevation models are created using the software DORIS (Delft Object-oriented Radar Interferometric Software) and have a high spatial resolution of approximately 6m in azimuth and 4-6m in range direction. TanDEM-X is very well suited for volcanic areas, as both satellites acquire data simultaneously and therefore atmospheric and ionospheric disturbances, temporal decorrelation and decorrelation due to deformation are negligible. Here, we focus on the southern flank of the volcano as well as its crater. Comparing the elevation from different years shows that significant elevation changes of up to several tens of meters occur both on the flank and crater during the observation period, even only within a few months. The biggest observed elevation changes took place between September 2011 and January 2016. Between January 2016 and April 2019, there has hardly been any change in elevation at the southern flank of the volcano. Between 2013 and 2016, a decrease in elevation of the crater of approximately 20m is observed, followed by a strong increase of up to 36m between 2016 and 2019. Our elevation measurements are well aligned with ground-based instrumental and visual observations and we are now focusing on determining flow shape and volume changes of lava flows within our observation period.
Imaging growing lava domes has remained a great challenge in volcanology due to their inaccessibility and the severe hazard of collapse or explosion. Changes in surface movement, temperature or lava viscosity are indicators for the current state of the activity and are thus considered crucial for hazard assessments at active lava domes. Here, we present results from a series of repeat survey flights with optical and thermal cameras at the Caliente lava dome at Santiaguito volcano, Guatemala, using an Unoccupied Aircraft System (UAS) to create topography data and orthophotos of the lava dome. This enables us to delineate the 2D deformation field and calculate flow velocity, strain components, and apparent lava viscosity. We find that the lava dome displays motions on two separate timescales, firstly a narrow and fast-moving lava extrusion and secondly a slower radial expansion of the dome. Both processes also produce distinctive fracture sets detectable with surface motion and the lava extrusion shows associated thermal anomalies. Our results highlight that motion patterns at lava domes control the structural and thermal architecture and different timescales should be considered to better characterize surface motions during dome growth to improve the assessment of volcanic hazards.
It is 135 years after the 1883 volcano-triggered tsunami disaster, when Krakatau volcano became once more the source of a deadly tsunami striking without warning. We use data recorded on the ground and by satellite, to show that the volcano was in an elevated stage of activity throughout the year 2018, producing thermal anomalies associated with volcanic deposits, an increase of the island area and ground movement of the southwestern sector of the island towards the sea, increasing in June 2018. Following further intense activity on 22 December 2018, seismic data reveal the timing and duration when this sector collapsed. The landslide removed 102 million m³ of material subaerially, which was followed by ~15 minutes of phreatic explosions. This study allows better understanding of the complex hazard cascades, including precursory thermal anomalies, island growth and deformation, followed by sector collapse, tsunami waves, and finally explosive volcanic eruptions, and has important implications for designing early warning systems.
Where will the next PoV take place?
Do we want to change something? Date, annually or every other year, format of talks/posters, fees for non-students?